Project Summary for Public Good Impact Blog
By Dr. Jing Li
Geospatial Analysis Project is a course taught every year by Dr. Jing Li in DU's Department of Geography & the Environment, in which upper-level undergraduates and graduate students complete GIS projects for a real community partner. In the course, students first learn how to use ArcGIS Online before hearing a presentation about current GIS needs from a community partner organization. They then divide into teams and complete the full GIS project life cycle, including collecting and cleaning data, designing web apps, refining apps through peer review, and developing a user guide. In the last week of the quarter, students present their results directly to the client.
This year, the course partnered with Metro Denver Nature Alliance (Metro DNA), a local nonprofit dedicated to aligning nature-based efforts to ensure more equitable access to nature and to promote healthy people, communities, and natural places in the Denver metro area. In the past, Metro DNA had conducted a regional conservation assessment and a regional equity assessment, and they hoped to identify meaningful patterns in the results from those projects, ultimately seeking areas where future investments could lead to high-impact outcomes for both environmental health and human well-being. Students, therefore, integrated the data from those past studies with high-quality, up-to-date datasets published by the Colorado Department of Health and the Environment, the Denver Regional Council of Governments, the U.S. Census Bureau, and more to create web apps aligned with Metro DNA's needs.
The maps and tools created by this year's students support Metro DNA's current work and planning initiatives by
Identifying new data sources and layers relevant to regional equity
Bringing previously used datasets up to date
Exploring overlaps between Metro DNA's equity and conservation data
Identifying areas where existing data resources are lacking, which could be an opportunity for future data collection projects
At the end of the quarter, students provided generally positive feedback, saying that the course improved their skills with ArcGIS Online, enhanced their project management and teamwork skills, and improved their confidence in applying their GIS skills to real-world problems. Some students also mentioned wanting to continue building their personal GIS portfolios and finding paid GIS positions working with real clients.
Because this community-engaged course seeks to solve real problems for real clients, it requires extensive coordination and preparation every time it is offered. The funding provided by CCESL in 2024 allowed Dr. Li to hire Jecca Bowen (a PhD candidate in the Department of Geography & the Environment) as a Research Assistant to help update the course materials and software tutorials while also communicating regularly with Metro DNA to understand their needs and goals for the partnership. Though preparation-intensive, this kind of community-engaged course offers powerful opportunities to support student growth, community problem-solving, and relationship-building between DU and local organizations. Dr. Li and everyone in this year's Geospatial Analysis Project course are grateful to CCESL for their generous support of this community-engaged project and many others across DU.
The students' final Hub Sites can be viewed at the links below:
Group 1: Advanced Environmental Justice
Group 2: Ensuring Easy Access
Group 3: Enabling Accessibility
Screenshots of hub sites
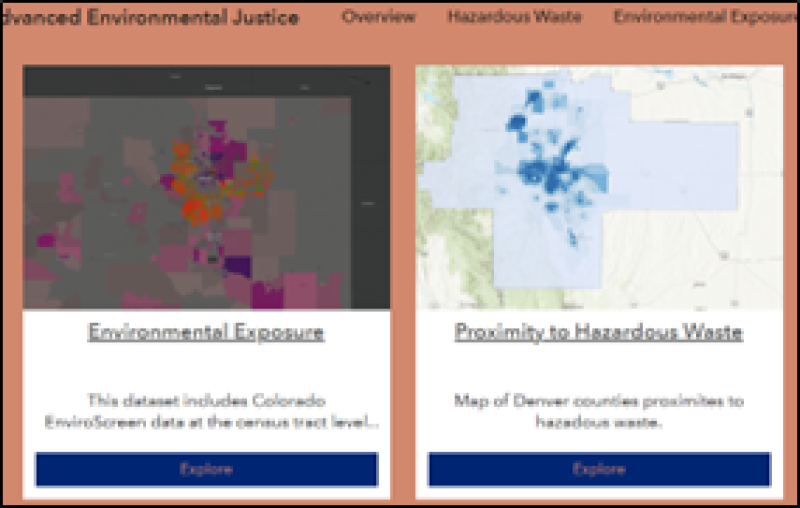
Group 1
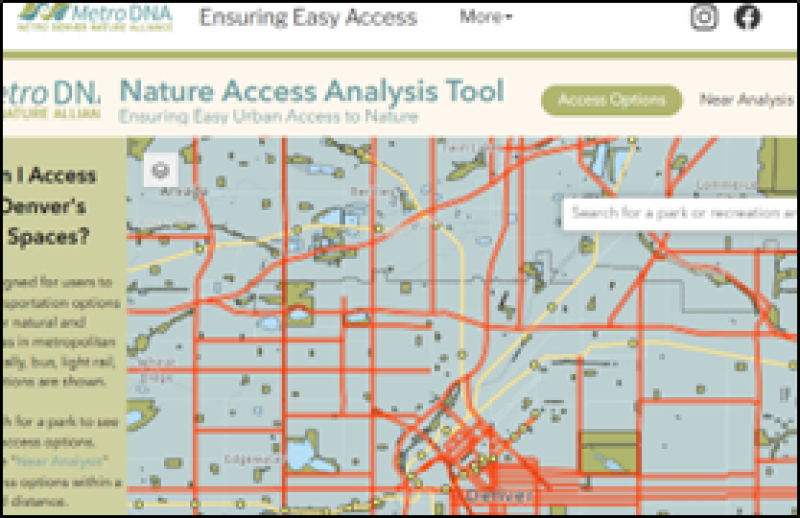
Group 2
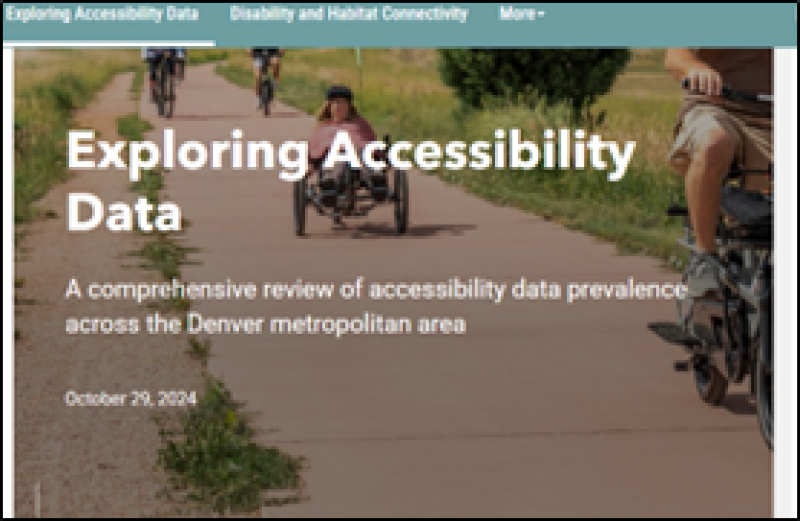
Group 3